Market Outlook
December 26, 2017
Market Cues
Domestic Indices
Chg (%)
(Pts)
(Close)
Indian markets are likely to open negative tracking global indices and SGX Nifty.
BSE Sensex
0.5
184
33,940
U.S. stocks remained closed on Monday because of the Christmas Holiday and
Nifty
0.5
53
10,493
Indices ended slightly lower on Friday, as many traders away from their desks,
Mid Cap
0.1
20
17,574
stocks turned in a relatively lackluster performance. The major indices spent much of
Small Cap
0.6
110
18,991
the day in negative territory before closing modestly lower. The Dow dipped 0.1% to
Bankex
0.3
101
28,982
24,754. The NASDAQ edged down 0.1% to 6,960 and the S&P 500 slipped 0.1% to
2,683.
Global Indices
Chg (%)
(Pts)
(Close)
The FTSE 100 index UKX, -0.15% fell 0.2% to 7,593, edging back from a record,
Dow Jones
(0.1)
(28)
24,754
with investors receiving the final look at British economic growth for the third quarter
as they wrapped up what ended as a winning week for the market.
Nasdaq
(0.1)
(5)
6,960
FTSE
(0.1)
(11)
7,593
ON domestic front, Indian indices closed at fresh record highs on Friday as mild
Nikkei
(0.1)
(13)
22,926
global cues amid signs of a steady revival in the U.S. economy buoyed investor
Hang Seng
0.7
211
29,578
sentiment and broad base rally in PSU bank was also lifted Indian indices. With PNB
Shanghai Com
0.2
7
3,288
and SBI rising about 1% each. Allahabad Bank jumped over 4%.The Sensex gained
0.55% to finish at 33,940 while the Nifty index ended up or 0.50% to close at
10,493.
Advances / Declines
BSE
NSE
Advances
1,581
1,032
News Analysis
Declines
1,193
735
HDFC MF to raise `4,000Cr via IPO
Unchanged
174
69
Detailed analysis on Pg2
Volumes (` Cr)
Investor’s Ready Reckoner
BSE
4,833
Key Domestic & Global Indicators
NSE
30,475
Stock Watch: Latest investment recommendations on 150+ stocks
Refer Pg5 onwards
Net Inflows (` Cr)
Net
Mtd
Ytd
Top Picks
FII
(1,309)
(6,698)
50,935
CMP
Target
Upside
Company
Sector
Rating
(`)
(`)
(%)
*MFs
1,012
6,114 1,16,352
Blue Star
Capital Goods Accumulate
796
867
8.9
Dewan Housing Finance
Financials
Buy
593
712
20.0
Top Gainers
Price (`)
Chg (%)
Asian Granito
Other
Accumulate
539
570
5.8
Network18
60
10.6
Navkar Corporation
Other
Buy
190
265
39.8
Eclerx
1,504
9.9
KEI Industries
Capital Goods
Buy
364
436
19.8
More Top Picks on Pg4
Rnaval
43
9.0
Il&Fstrans
83
8.1
Key Upcoming Events
Gspl
221
7.4
Previous
Consensus
Date
Region
Event Description
Reading
Expectations
Dec27
US
Initial Jobless claims
245.00
Top Losers
Price (`)
Chg (%)
Dec28
US
Consumer Confidence
129.50
128.00
Rcom
16
(9.2)
Dec31
China
PMI Manufacturing
51.80
51.70
Ifci
27
(5.2)
Jan02
Germany Unemployment change (000's)
(18.00)
(12.00)
Jan02
Germany PMI Manufacturing
63.30
63.30
Unitech
8
(3.8)
More Events on Pg7
Ltts
989
(2.7)
Canfinhome
496
(2.7)
As on December 22 2017
Market Outlook
December 26, 2017
News Analysis
HDFC MF to raise `4,000cr via IPO
India's largest mortgage company HDFCLtd and its British joint venture partner
Standard Life Investments are planning to raise ` 4,000cr by selling a 10% stake in
asset management company HDFC Mutual Fund, valuing it at `40,000cr. HDFC
MF is 60% owned by HDFC while Standard Life Investments holds the rest. As per
board announcement both will sell about 5% stake each in the IPO.
It is perfect time for AMC to get decent valuation and investor response owing to
A) as mutual fund industry is still at a nascent stage with less than 4% of the
population investing in mutual funds b) Investors have been pumping around `
5,000cr every month into Systemic Investment Planning schemes of mutual funds
c) Demonetisation in November 2016 accelerated the shift from physical savings
to financial savings
This will be second AMC which would get listed in bourses after Reliance Nippon
Asset Management raised `1,540cr in November by selling a 10% stake in the
primary market.
With asset under management of `2.92lakh cr, HDFC MF is the most profitable
asset management company, having posted a net profit of `550cr for the year
ended March 31. Net profit stood at `310cr in the six months to September.
Economic and Political News
Commerce Ministry mulls refund for exporters via single window
Govt starts safeguard duty probe on solar cells
Budget 2018: GST to steal Jaitley’s thunder on indirect taxes
Govt looking at putting some profitable PSUs too on the block
Corporate News
BHEL gets `672cr order from Indian Railways.
Larsen & Toubro gets Delhi Expo Centre phase-I contract for `2,790cr.
ThyssenKrupp to have 50 percent stake in Tata Steel joint venture for six
years.
GVK Power unit wins bid for 17,06,300 tones coal.
SEBI revokes shell company status on Prakash Industries.
Market Outlook
December 26, 2017
Top Picks HHHHH
Market Cap
CMP
Target
Upside
Company
Rationale
(` Cr)
(`)
(`)
(%)
Strong growth in domestic business due to its leade`hip
in acute therapeutic segment. Alkem expects to launch
Alkem Laboratories
25,708
2,150
2,341
8.9
more products in USA, which bodes for its international
business.
We expect the company would report strong profitability
Asian Granito
1,621
539
570
5.8
owing to better product mix, higher B2C sales and
amalgamation synergy.
Favorable outlook for the AC industry to augur well for
Cooling products business which is out pacing the
Blue Star
7,636
796
867
8.9
market growth. EMPPAC division's profitability to
improve once operating environment turns around.
With a focus on the low and medium income (LMI)
consumer segment, the company has increased its
Dewan Housing Finance
18,609
593
712
20.0
presence in tier-II & III cities where the growth
opportunity is immense.
Loan growth is likely to pick up after a sluggish FY17.
Lower credit cost will help in strong bottom-line growth.
Karur Vysya Bank
8,872
123
180
46.4
Increasing share of CASA will help in NIM
improvement.
High order book execution in EPC segment, rising B2C
KEI Industries
2,851
364
436
19.8
sales and higher exports to boost the revenues and
profitability
Expected to benefit from the lower capex requirement
Music Broadcast
2,166
380
434
14.3
and 15 year long radio broadcast licensing.
Massive capacity expansion along with rail advantage
Navkar Corporation
2,853
190
265
39.8
at ICD as well CFS augur well for the company
Strong brands and distribution network would boost
Siyaram Silk Mills
3,499
747
800
7.2
growth going ahead. Stock currently trades at an
inexpensive valuation.
Market leadership in Hindi news genre and no.
2
viewership ranking in English news genre, exit from the
TV Today Network
2,776
465
500
7.4
radio business, and anticipated growth in ad spends by
corporate to benefit the stock.
After GST, the company is expected to see higher
volumes along with improving product mix. The Gujarat
Maruti Suzuki
2,93,025
9,700
10,619
9.5
plant will also enable higher operating leverage which
will be margin accretive.
We expect loan book to grow at 24.3% over next two
GIC Housing
2,382
442
655
48.1
year; change in borrowing mix will help in NIM
improvement
We expect CPIL to report net Revenue/PAT CAGR of
~17%/16% over FY2017-20E mainly due to healthy
7,476
337
400
18.9
growth in plywood & lamination business, forayed into
Century Plyboards India
MDF & Particle boards on back of strong brand &
distribution network.
We expect sales/PAT to grow at 13.5%/20% over next
LT Foods
2,282
86
96
12.2
two years on the back of strong distribution network &
addition of new products in portfolio.
We expect sales/PAT to grow at 13%/16% over next two
years on the back of strong healthy demand in writing
Ruchira Papers
446
199
244
22.8
& printing paper and Kraft paper. Further, China had
banned making paper from waste pulp which would
benefit Indian paper companies.
Source: Company, Angel Research
Market Outlook
December 26, 2017
Key Upcoming Events
Global economic events release calendar
Bloomberg Data
Date
Time Country
Event Description
Unit
Period
Last Reported
Estimated
Dec 27, 2017
7:00 PMUS
Initial Jobless claims
Thousands
Dec 23
245.00
Dec 28, 2017
8:30 PMUS
Consumer Confidence
S.A./ 1985=100
Dec
129.50
128.00
Dec 31, 2017
6:30 AMChina
PMI Manufacturing
Value
Dec
51.80
51.70
Jan 02, 2018
2:25 PMGermany
Unemployment change (000's)
Thousands
Dec
(18.00)
(12.00)
2:25 PMGermany
PMI Manufacturing
Value
Dec F
63.30
63.30
Jan 03, 2018
3:00 PMUK
PMI Manufacturing
Value
Dec
58.20
57.80
Jan 04, 2018
2:25 PMGermany
PMI Services
Value
Dec F
55.80
55.80
Jan 05, 2018
7:00 PMUS
Change in Nonfarm payrolls
Thousands
Dec
228.00
185.00
7:00 PMUS
Unnemployment rate
%
Dec
4.10
4.00
Jan 08, 2018
3:30 PMEuro Zone
Euro-Zone Consumer Confidence
Value
Dec F
0.50
Jan 10, 2018
3:00 PMUK
Industrial Production (YoY)
% Change
Nov
3.60
India
Imports YoY%
% Change
Dec
19.60
India
Exports YoY%
% Change
Dec
30.60
Jan 11, 2018
US
Producer Price Index (mom)
% Change
Dec
1.40
Jan 12, 2018
China
Exports YoY%
% Change
Dec
12.30
12:00 PMIndia
Monthly Wholesale Prices YoY%
% Change
Dec
3.93
Jan 15, 2018
7:00 PMUS
Consumer price index (mom)
% Change
Dec
0.40
Jan 16, 2018
3:00 PMUK
CPI (YoY)
% Change
Dec
3.10
Jan 17, 2018
3:30 PMEuro Zone
Euro-Zone CPI (YoY)
%
Dec F
1.50
7:45 PMUS
Industrial Production
%
Dec
0.20
Jan 18, 2018
7:00 PMUS
Housing Starts
Thousands
Dec
1,297.00
7:00 PMUS
Building permits
Thousands
Dec
1,298.00
Jan 24, 2018
8:30 PMUS
Existing home sales
Million
Dec
5.81
3:00 PMUK
Jobless claims change
% Change
Dec
5.90
Source: Bloomberg, Angel Research
Market Outlook
December 26, 2017
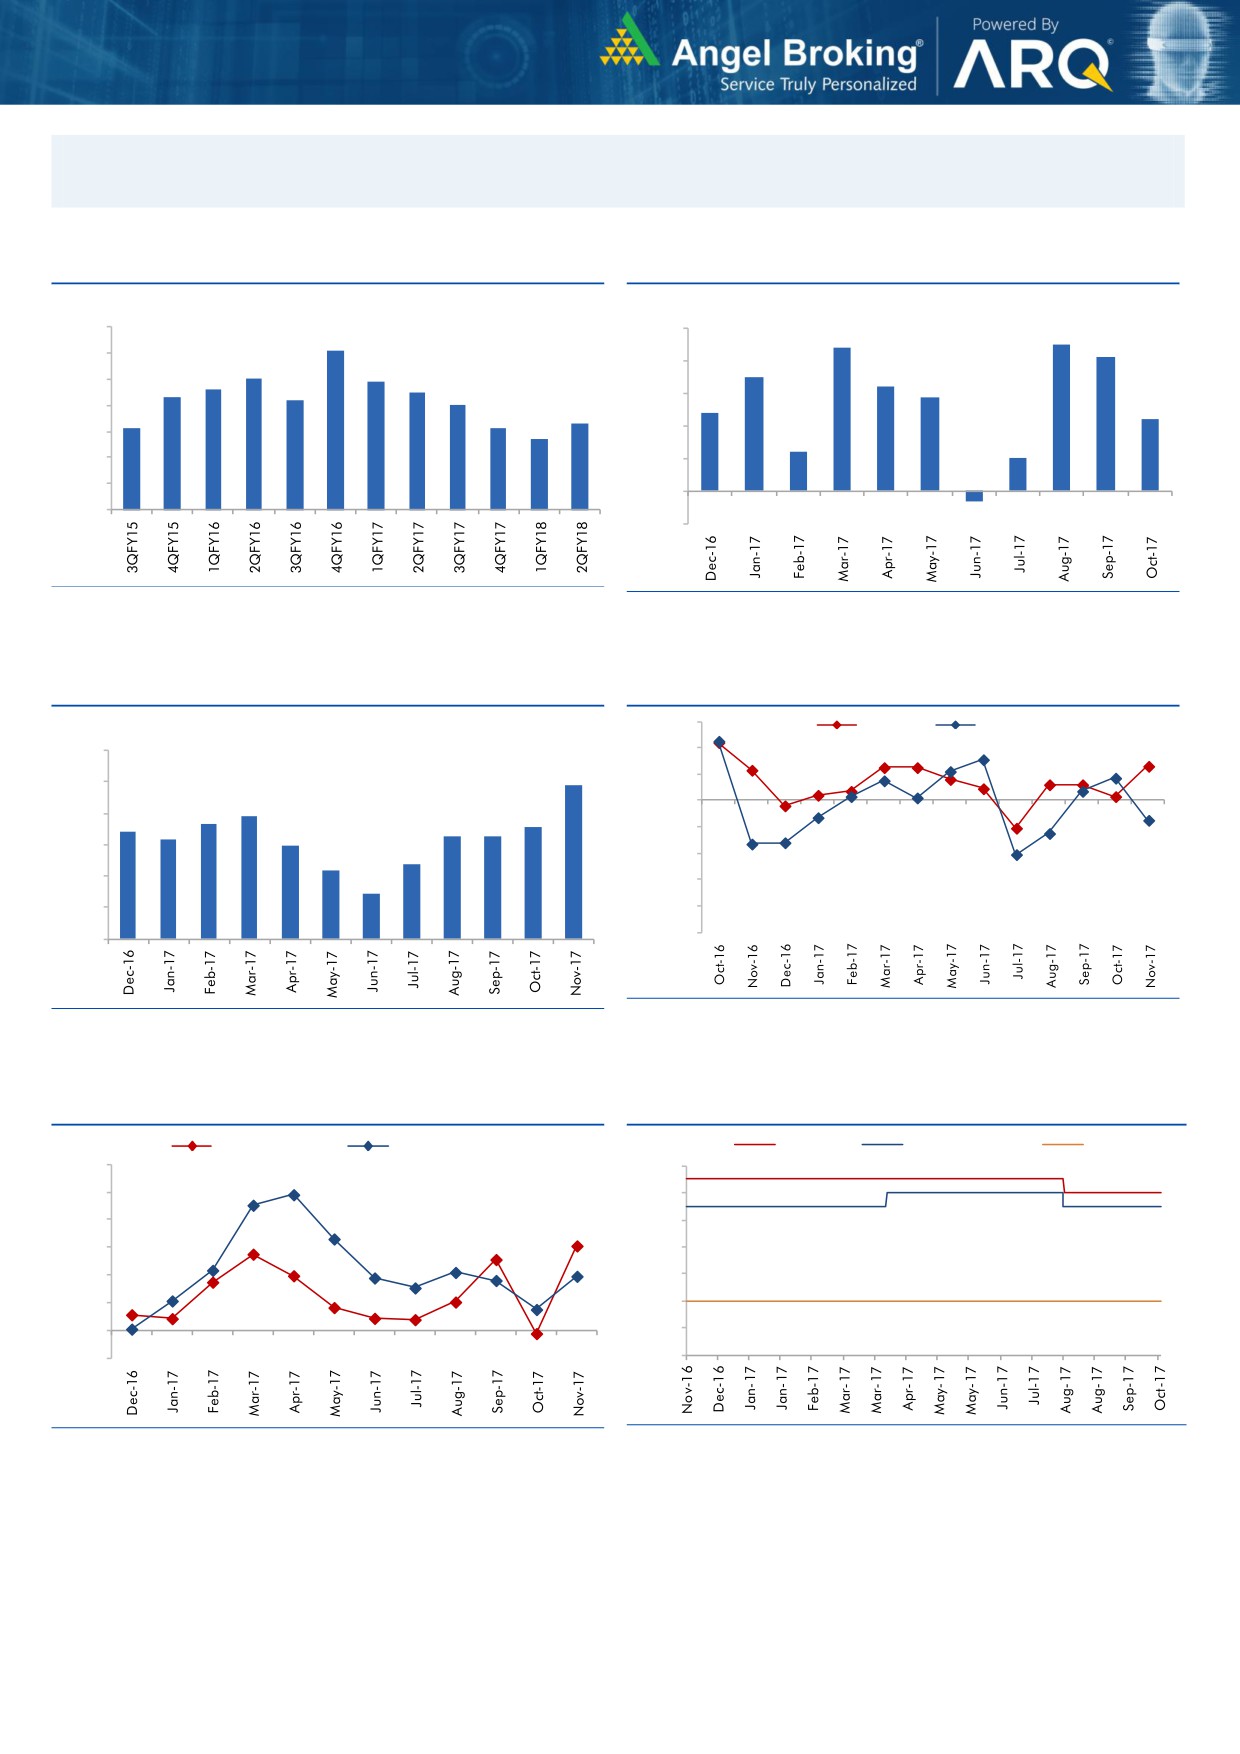
Macro watch
Exhibit 1: Quarterly GDP trends
Exhibit 2: IIP trends
(%)
(%)
10.0
5.0
4.5
9.1
4.4
4.1
9.0
8.0
7.9
4.0
3.5
7.6
7.5
3.2
8.0
7.3
7.2
2.9
7.0
3.0
2.4
7.0
6.3
2.2
6.1
6.1
5.7
2.0
6.0
1.2
1.0
5.0
1.0
4.0
-
3.0
(1.0)
(0.3)
Source: CSO, Angel Research
Source: MOSPI, Angel Research
Exhibit 3: Monthly CPI inflation trends
Exhibit 4: Manufacturing and services PMI
56.0
Mfg. PMI
Services PMI
(%)
6.0
54.0
4.9
52.0
5.0
3.9
50.0
4.0
3.7
3.6
3.4
3.3
3.3
3.2
3.0
48.0
3.0
2.4
2.2
46.0
2.0
1.5
44.0
1.0
42.0
40.0
-
Source: Market, Angel Research; Note: Level above 50 indicates expansion
Source: MOSPI, Angel Research
Exhibit 5: Exports and imports growth trends
Exhibit 6: Key policy rates
(%)
Exports yoy growth
Imports yoy growth
(%)
Repo rate
Reverse Repo rate
CRR
60.0
6.50
50.0
6.00
40.0
5.50
30.0
5.00
20.0
4.50
10.0
4.00
0.0
3.50
(10.0)
3.00
Source: Bloomberg, Angel Research
Source: RBI, Angel Research
Market Outlook
December 26, 2017
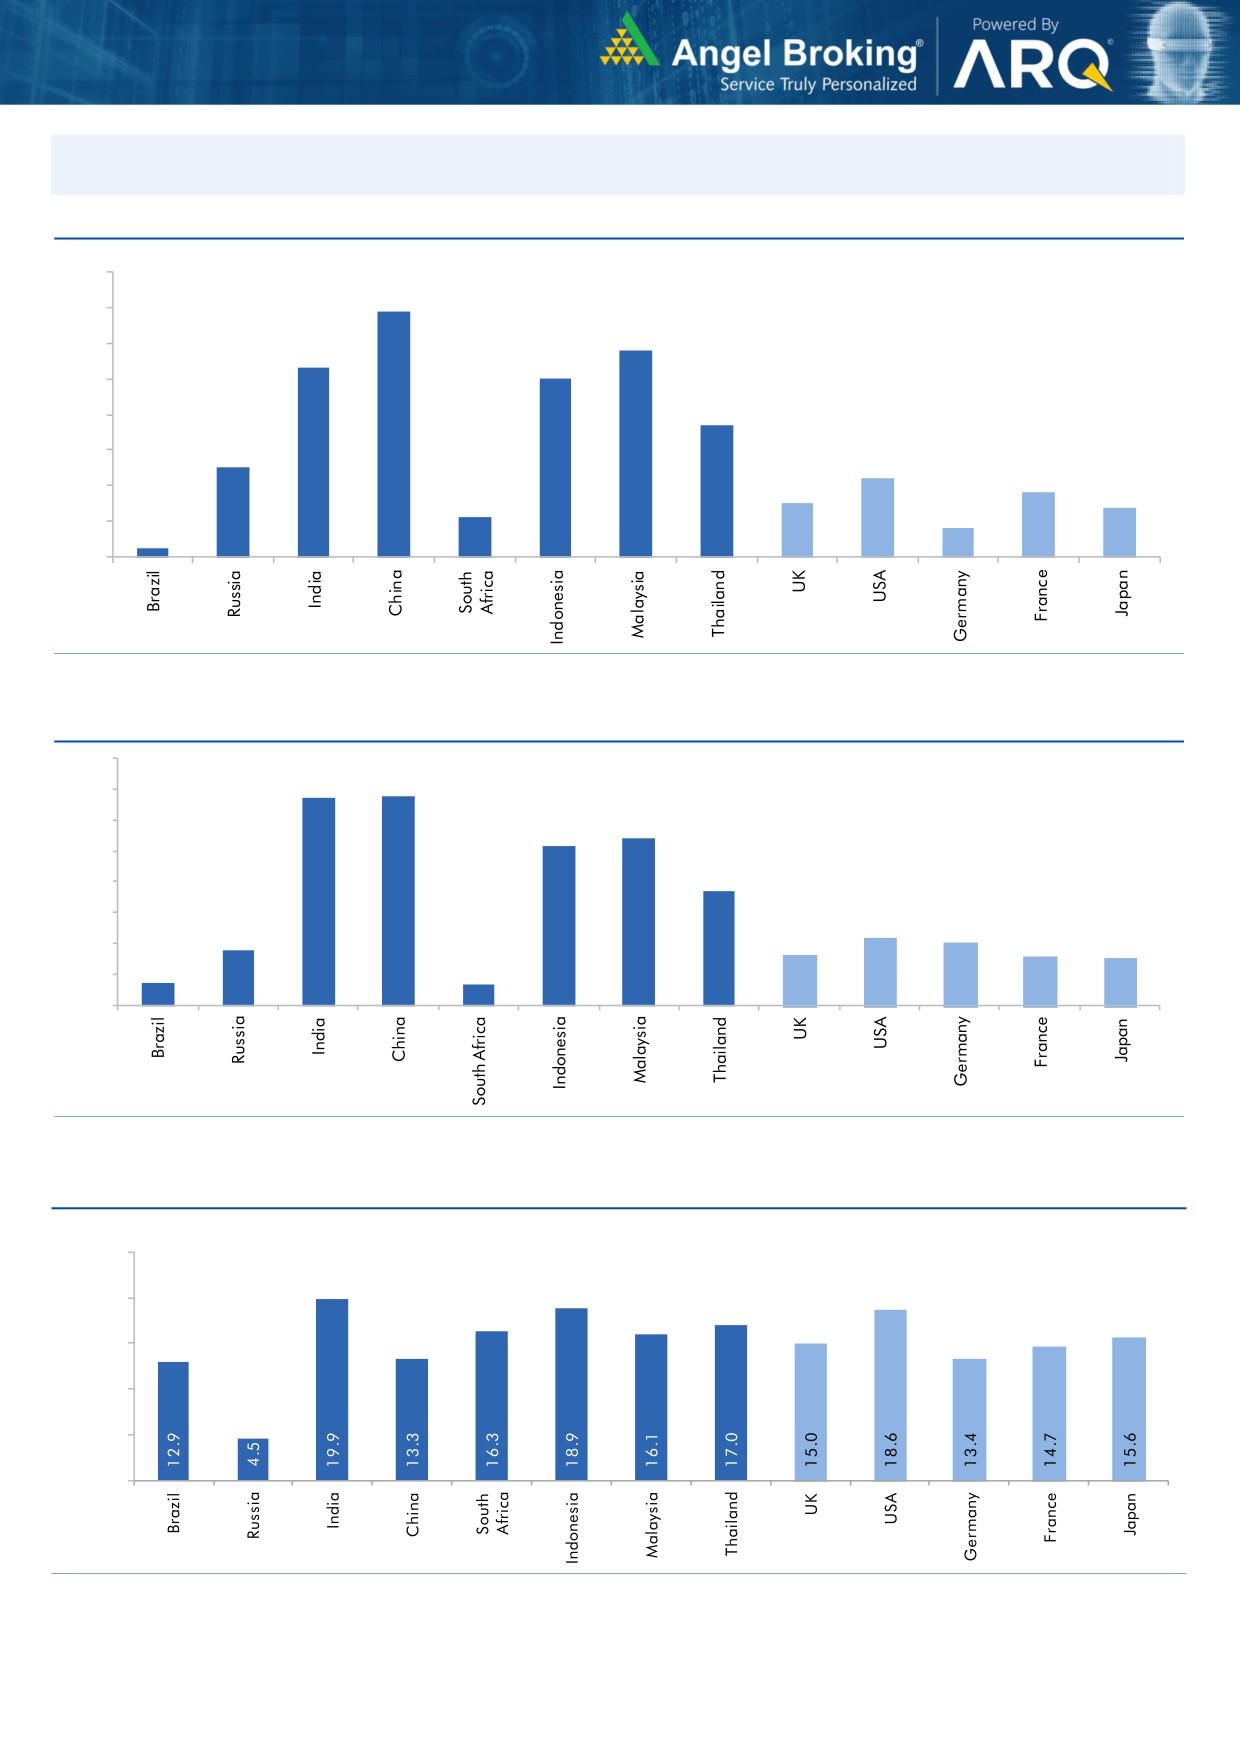
Global watch
Exhibit 1: Latest quarterly GDP Growth (%, yoy) across select developing and developed countries
(%)
8.0
6.9
7.0
5.8
6.0
5.3
5.0
5.0
1.1
3.7
4.0
2.5
3.0
2.2
1.8
2.0
1.5
1.4
0.8
1.0
0.3
-
Source: Bloomberg, Angel Research
Exhibit 2: 2017 GDP Growth projection by IMF (%, yoy) across select developing and developed countries
(%)
6.7
6.8
7.0
6.0
5.4
5.2
5.0
3.7
4.0
3.0
1.8
2.2
2.0
1.7
1.6
2.0
0.7
1.5
0.7
1.0
-
Source: IMF, Angel Research
Exhibit 3: One year forward P-E ratio across select developing and developed countries
(x)
25.0
20.0
15.0
10.0
5.0
-
Source: IMF, Angel Research
Market Outlook
December 26, 2017
Exhibit 4: Relative performance of indices across globe
Returns (%)
Country
Name of index
Closing price
1M
3M
1YR
Brazil
Bovespa
75,133
0.7
(1.1)
28.7
Russia
Micex
2,093
(2.6)
2.6
(3.4)
India
Nifty
10,440
1.5
3.7
30.2
China
Shanghai Composite
3,300
(3.9)
(2.0)
5.0
South Africa
Top 40
52,082
(4.5)
5.0
19.5
Mexico
Mexbol
48,503
1.4
(3.5)
7.4
Indonesia
LQ45
1,045
4.5
7.2
19.2
Malaysia
KLCI
1,751
1.9
(1.4)
6.4
Thailand
SET 50
1,125
3.4
5.1
18.8
USA
Dow Jones
24,782
5.8
10.8
24.4
UK
FTSE
7,604
2.6
4.0
7.6
Japan
Nikkei
22,866
2.7
12.6
18.6
Germany
DAX
13,110
0.6
3.9
14.1
France
CAC
5,386
0.4
2.0
10.1
Source: Bloomberg, Angel Research p68in4
Stock Watch
December 26, 2017
Company Name
Reco
CMP
Target
Mkt Cap
Sales ( Čcr )
OPM(%)
EPS (Č)
PER(x)
P/BV(x)
RoE(%)
EV/Sales(x)
(Č)
Price ( Č)
( Č cr )
FY18E FY19E
FY18E
FY19E
FY18E
FY19E
FY18E
FY19E
FY18E
FY19E
FY18E
FY19E
FY18E
FY19E
Agri / Agri Chemical
Rallis
Sell
258
209
5,022
1,873
2,099
15.0
15.0
9.5
10.5
27.2
24.6
4.1
3.7
15.8
16.0
2.6
2.3
United Phosphorus
Accumulate
731
820
37,176
18,922
21,949
18.0
18.5
36.2
45.6
20.2
16.0
4.2
3.5
22.7
23.8
2.1
1.8
Auto & Auto Ancillary
Ashok Leyland
Accumulate
118
127
34,393
23,339
27,240
10.1
10.8
4.7
6.2
25.3
18.9
5.1
4.5
20.0
23.6
1.4
1.2
Bajaj Auto
Neutral
3,326
-
96,256
23,936
27,955
19.5
20.1
142.7
167.3
23.3
19.9
5.1
4.5
21.8
22.8
3.6
3.0
Bharat Forge
Buy
729
875
33,953
7,637
8,755
21.7
23.2
36.1
47.3
20.2
15.4
3.6
3.1
18.5
20.8
4.3
3.7
Eicher Motors
Neutral
30,240
-
82,364
19,043
22,837
19.5
19.9
835.4
1,019.0
36.2
29.7
13.5
10.4
40.9
37.8
4.2
3.4
Gabriel India
Neutral
193
-
2,776
1,782
2,033
9.7
10.2
7.1
8.9
27.2
21.8
5.5
4.6
21.0
22.2
1.5
1.3
Hero Motocorp
Accumulate
3,786
4,129
75,608
32,239
36,878
16.0
15.6
184.4
206.5
20.5
18.3
6.5
5.7
31.3
30.7
2.1
1.8
Jamna Auto Industries Neutral
77
-
3,074
1,441
1,662
14.4
14.8
13.9
17.6
5.6
4.4
1.5
1.2
30.0
31.0
2.1
1.8
Mahindra and Mahindra Neutral
746
-
92,748
46,971
53,816
13.6
14.0
67.7
79.8
11.0
9.4
1.6
1.4
15.0
15.9
1.9
1.6
Maruti
Accumulate
9,700
10,619
293,025
79,470
95,208
15.9
17.2
281.7
363.8
34.4
26.7
7.5
6.1
21.7
22.8
3.4
2.7
Minda Industries
Neutral
1,313
-
11,350
4,328
5,084
11.0
11.9
27.3
36.4
48.2
36.1
10.2
8.0
23.1
25.6
2.7
2.3
Motherson Sumi
Neutral
376
-
79,186
55,937
64,445
10.8
11.4
16.9
21.1
22.3
17.9
5.0
5.1
25.2
25.4
1.5
1.2
Tata Motors
Neutral
422
-
121,817
303,167
343,649
11.8
13.8
33.1
54.7
12.8
7.7
2.1
1.7
16.9
23.0
0.5
0.4
TVS Motor
Neutral
775
-
36,812
13,992
16,216
9.0
9.4
17.1
20.3
45.5
38.2
12.1
9.3
29.7
27.7
2.6
2.2
Amara Raja Batteries
Neutral
833
-
14,235
6,140
7,122
14.3
15.6
29.3
39.0
28.4
21.4
4.9
4.1
17.1
19.0
2.3
2.0
Exide Industries
Neutral
220
-
18,717
8,689
9,854
15.1
15.2
9.7
11.0
22.8
20.0
4.0
3.6
15.7
16.1
1.9
1.6
Apollo Tyres
Neutral
265
-
15,136
15,739
17,326
13.3
14.6
20.4
26.7
13.0
9.9
1.6
1.4
20.4
26.7
1.2
1.1
Ceat
Neutral
1,948
-
7,882
6,661
7,717
11.1
14.2
116.2
178.2
16.8
10.9
2.9
2.4
15.2
21.3
1.3
1.1
JK Tyres
Neutral
146
-
3,300
8,318
9,239
16.2
16.4
21.0
27.5
7.0
5.3
1.4
1.1
19.1
20.4
0.8
0.7
Swaraj Engines
Neutral
2,031
-
2,523
788
889
16.4
16.5
71.6
81.0
28.4
25.1
8.2
7.6
29.6
31.0
2.9
2.5
Subros
Neutral
295
-
1,768
1,855
2,135
11.6
11.8
10.3
14.7
28.8
20.1
4.4
3.7
15.8
19.1
1.2
1.0
Capital Goods
BEML
Neutral
1,603
-
6,676
4,286
5,194
7.1
8.2
42.9
58.1
37.4
27.6
3.1
2.8
7.6
8.7
1.6
1.3
Bharat Electronics
Neutral
189
-
46,327
10,258
12,470
19.6
19.5
7.3
8.6
25.8
21.9
0.5
0.4
20.4
21.9
4.0
3.3
Voltas
Neutral
657
-
21,723
6,778
8,004
9.6
11.0
17.1
22.4
38.4
29.3
9.2
8.0
17.7
19.8
2.9
2.4
BHEL
Neutral
92
-
33,850
33,200
39,167
6.8
9.5
6.2
11.2
14.9
8.2
0.7
0.7
4.6
8.0
0.6
0.5
Blue Star
Accumulate
796
867
7,636
5,220
6,207
6.3
6.6
16.8
22.3
47.4
35.7
9.4
8.3
19.9
23.3
1.4
1.2
CG Power and Industrial
Neutral
91
-
5,691
6,555
7,292
7.5
7.5
-
0.8
9,080.0
113.5
1.4
1.4
0.1
1.2
1.0
0.9
Solutions
Greaves Cotton
Neutral
131
-
3,194
1,778
1,993
14.7
15.1
8.1
9.1
16.2
14.4
3.6
3.4
21.8
23.6
1.6
1.4
Stock Watch
December 26, 2017
Company Name
Reco
CMP
Target
Mkt Cap
Sales ( Čcr )
OPM(%)
EPS (Č)
PER(x)
P/BV(x)
RoE(%)
EV/Sales(x)
(Č)
Price ( Č)
( Č cr )
FY18E FY19E
FY18E
FY19E
FY18E
FY19E
FY18E
FY19E
FY18E
FY19E
FY18E
FY19E
FY18E
FY19E
Capital Goods
KEC International
Neutral
378
-
9,727
9,779
11,113
9.4
9.8
14.2
18.2
26.6
20.8
5.1
4.2
21.1
22.1
1.3
1.1
KEI Industries
Buy
363
436
2,847
3,001
3,391
10.0
10.0
13.0
16.1
27.9
22.6
5.1
4.2
18.2
18.7
1.1
1.0
Thermax
Neutral
1,218
-
14,511
4,125
4,747
10.3
10.8
26.7
31.5
45.6
38.7
5.1
4.7
11.2
12.0
3.2
2.8
VATech Wabag
Accumulate
615
681
3,362
3,867
4,126
9.6
10.0
34.9
39.8
17.6
15.5
2.9
2.5
17.7
17.5
0.9
0.8
Cement
ACC
Neutral
1,721
-
32,321
12,255
13,350
13.5
14.3
58.0
66.2
29.7
26.0
3.5
3.3
11.5
12.2
2.6
2.4
Ambuja Cements
Neutral
268
-
53,116
10,250
11,450
17.5
19.0
7.2
8.3
37.2
32.2
2.7
2.5
7.0
7.8
5.0
4.4
India Cements
Neutral
183
-
5,644
6,135
6,750
14.8
15.2
8.5
11.5
21.6
15.9
1.1
1.0
4.8
6.2
1.3
1.1
JK Cement
Neutral
1,086
-
7,591
4,150
4,775
19.2
20.0
49.0
63.5
22.2
17.1
3.5
3.0
17.0
18.5
2.3
1.9
J K Lakshmi Cement
Neutral
446
-
5,248
3,422
3,757
15.5
17.0
13.5
23.2
33.0
19.2
3.4
3.0
10.8
15.5
1.9
1.7
Orient Cement
Neutral
166
-
3,391
2,215
3,233
16.8
17.0
5.9
6.9
28.1
24.0
2.1
2.0
10.8
10.1
2.5
1.7
Prism Cement
Accumulate
116
131
5,862
5,155
5,616
7.0
7.0
2.0
3.0
58.2
38.8
5.3
4.6
10.0
13.8
1.4
1.3
UltraTech Cement
Neutral
4,287
-
117,699
28,250
35,150
20.2
23.5
77.5
122.2
55.3
35.1
4.7
4.2
9.6
14.8
4.6
3.7
Construction
KNR Constructions
Neutral
308
-
4,332
1,846
2,203
14.5
14.5
12.1
13.7
25.5
22.6
1.4
1.2
17.5
16.7
2.4
2.0
Larsen & Toubro
Neutral
1,267
-
177,462
95,787
109,476
10.2
11.6
44.5
50.8
28.5
25.0
3.6
3.3
12.9
13.1
2.4
2.1
Gujarat Pipavav Port
Neutral
136
-
6,592
739
842
61.6
62.7
5.1
6.2
26.7
22.2
3.3
3.3
12.7
14.9
8.4
7.2
PNC Infratech
Neutral
213
-
5,459
2,040
2,935
13.0
13.0
6.4
9.0
33.3
23.6
0.9
0.8
9.7
12.2
2.7
1.9
Simplex Infra
Neutral
576
-
2,849
6,012
6,619
11.6
11.7
21.1
31.0
27.4
18.6
1.9
1.7
6.5
8.6
1.0
0.9
Sadbhav Engineering
Neutral
414
-
7,102
3,823
4,426
10.7
10.8
10.3
11.8
40.2
35.1
4.8
4.2
10.1
10.5
2.2
1.9
NBCC
Neutral
254
-
22,856
9,099
12,706
6.4
6.4
7.3
9.6
34.9
26.6
1.5
1.2
27.5
30.5
2.4
1.7
MEP Infra
Neutral
96
-
1,558
2,403
2,910
18.3
16.8
2.4
6.1
40.8
15.8
15.5
10.4
35.2
55.8
1.8
1.5
SIPL
Neutral
147
-
5,179
2,060
2,390
46.8
47.7
(5.8)
(3.1)
5.5
6.3
(14.2)
(2.3)
7.3
6.7
Engineers India
Neutral
205
-
13,808
1,795
2,611
21.1
22.4
5.9
8.1
34.7
25.3
2.5
2.4
12.9
16.1
6.1
4.0
Financials
Axis Bank
Neutral
554
-
132,760
32,558
35,843
3.5
3.2
27.8
41.0
19.9
13.5
2.2
1.9
11.4
14.9
-
-
Bank of Baroda
Neutral
168
-
38,698
22,533
26,079
2.4
2.4
12.0
20.9
14.0
8.0
0.9
0.9
6.6
11.0
-
-
Canara Bank
Neutral
370
-
22,097
17,925
20,235
2.0
2.1
18.5
36.5
20.0
10.1
0.8
0.7
3.4
6.2
-
-
Can Fin Homes
Neutral
496
-
6,597
586
741
3.5
3.5
107.8
141.0
4.6
3.5
1.0
0.8
24.1
25.6
-
-
Cholamandalam Inv. &
Neutral
1,295
-
20,235
2,826
3,307
6.3
6.3
53.7
64.6
24.1
20.1
4.1
3.5
18.3
18.9
-
-
Fin. Co.
Dewan Housing Finance Buy
593
712
18,609
2,676
3,383
2.4
2.7
37.4
49.7
15.9
11.9
2.1
1.8
13.8
16.2
-
-
Equitas Holdings
Buy
144
235
4,885
1,125
1,380
9.6
9.8
1.5
6.0
95.9
24.0
2.2
2.0
2.4
8.2
-
-
Stock Watch
December 26, 2017
Company Name
Reco
CMP
Target
Mkt Cap
Sales ( Čcr )
OPM(%)
EPS (Č)
PER(x)
P/BV(x)
RoE(%)
EV/Sales(x)
(Č)
Price ( Č)
( Č cr )
FY18E FY19E
FY18E
FY19E
FY18E
FY19E
FY18E
FY19E
FY18E
FY19E
FY18E
FY19E
FY18E
FY19E
Financials
Federal Bank
Buy
108
125
21,147
4,896
5,930
2.8
3.1
5.4
7.6
20.1
14.2
1.7
1.6
8.5
11.0
-
-
GIC Housing
Buy
442
655
2,381
376
477
3.6
3.7
33.0
40.0
13.4
11.1
2.4
2.0
20.0
23.0
-
-
HDFC Bank
Neutral
1,877
-
485,870
55,236
63,253
4.5
4.4
68.9
82.4
27.3
22.8
4.8
3.9
18.7
18.5
-
-
ICICI Bank
Neutral
316
-
203,184
42,361
51,378
3.6
3.9
18.4
25.7
17.2
12.3
1.9
1.8
11.3
15.0
-
-
Karur Vysya Bank
Buy
123
180
8,872
3,289
3,630
3.7
3.9
10.8
14.1
11.4
8.7
1.4
1.2
12.5
14.7
-
-
LIC Housing Finance
Accumulate
568
630
28,675
4,895
6,332
3.4
3.7
50.7
66.8
11.2
8.5
2.2
1.9
21.7
23.8
-
-
Punjab Natl.Bank
Neutral
176
-
42,666
23,708
25,758
2.1
2.1
5.9
16.4
29.9
10.7
0.9
0.8
3.0
8.3
-
-
RBL Bank
Neutral
515
-
21,491
2,309
2,888
2.6
2.5
16.4
19.1
31.5
27.0
4.0
3.5
13.3
13.8
-
-
Repco Home Finance
Buy
686
825
4,289
496
597
4.4
4.2
38.5
48.7
17.8
14.1
3.2
2.7
19.6
20.6
-
-
South Ind.Bank
Neutral
32
-
5,706
3,195
3,567
3.0
3.1
3.0
3.8
10.5
8.3
1.0
0.9
10.5
11.9
-
-
St Bk of India
Neutral
320
-
276,096
105,827
121,056
2.4
2.5
16.1
25.6
19.9
12.5
1.6
1.4
6.6
9.9
-
-
Union Bank
Neutral
148
-
12,687
14,650
16,225
2.3
2.3
23.1
32.5
6.4
4.6
0.5
0.4
7.1
9.2
-
-
Yes Bank
Neutral
310
-
71,272
11,088
13,138
3.0
2.9
84.0
99.3
3.7
3.1
0.6
0.5
16.3
16.8
-
-
FMCG
Akzo Nobel India
Neutral
1,798
-
8,623
3,164
3,607
13.8
13.7
58.6
67.9
30.7
26.5
7.5
6.6
24.5
25.1
2.6
2.2
Asian Paints
Neutral
1,137
-
109,013
17,603
20,615
18.6
18.6
2,128.9
2,543.3
0.5
0.5
11.3
9.5
28.0
28.9
6.0
5.0
Britannia
Neutral
4,745
-
56,966
9,690
11,278
14.8
15.4
84.0
101.0
56.5
47.0
20.6
16.4
40.6
39.0
5.8
5.0
Colgate
Neutral
1,091
-
29,682
4,420
5,074
24.9
25.3
28.6
32.8
38.2
33.3
15.1
12.2
43.8
40.5
6.5
5.6
Dabur India
Neutral
354
-
62,314
8,346
9,344
19.6
19.9
7.8
9.0
45.4
39.3
9.1
8.3
25.2
24.8
7.1
6.2
GlaxoSmith Con*
Neutral
6,483
-
27,263
5,072
5,760
18.2
18.4
176.3
199.2
36.8
32.5
7.8
7.1
21.2
21.7
4.7
4.1
Godrej Consumer
Neutral
987
-
67,264
10,171
11,682
20.8
21.5
21.7
27.1
45.5
36.4
10.2
8.8
22.3
23.4
6.7
5.8
HUL
Neutral
1,352
-
292,562
37,077
41,508
20.3
21.8
5,189.9
6,318.5
0.3
0.2
41.2
35.2
74.8
82.0
7.7
6.9
ITC
Neutral
263
-
320,977
44,588
49,853
37.0
37.3
9.6
11.0
27.4
23.9
6.7
6.4
25.1
27.3
6.7
5.9
Marico
Neutral
317
-
40,917
6,788
7,766
18.5
19.2
7.1
8.5
44.7
37.3
15.6
13.4
36.9
38.0
5.9
5.1
Nestle*
Neutral
7,868
-
75,855
10,083
11,182
20.0
20.9
119.7
141.3
65.7
55.7
231.6
211.7
36.7
39.8
7.2
6.4
Tata Global
Neutral
303
-
19,107
7,121
7,641
11.9
12.3
6.9
8.0
43.9
37.8
2.9
2.8
6.8
7.2
2.5
2.3
Procter & Gamble
Neutral
9,385
-
30,464
3,034
3,579
27.1
27.7
167.7
198.8
56.0
47.2
15.0
12.9
28.8
29.5
9.5
7.9
Hygiene
IT
HCL Tech^
Accumulate
887
1,014
126,517
50,009
54,608
22.1
22.1
62.8
67.6
14.1
13.1
3.2
2.7
22.4
20.6
2.2
1.9
Infosys
Accumulate
1,038
1,120
238,520
70,333
75,960
26.0
26.0
61.7
65.9
16.8
15.8
3.2
3.0
18.9
18.7
2.8
2.5
TCS
Reduce
2,640
2,442
505,334
123,384
134,488
26.1
26.1
133.2
143.7
19.8
18.4
5.5
5.1
27.6
27.8
3.8
3.4
Stock Watch
December 26, 2017
Company Name
Reco
CMP
Target
Mkt Cap
Sales ( Čcr )
OPM(%)
EPS (Č)
PER(x)
P/BV(x)
RoE(%)
EV/Sales(x)
(Č)
Price ( Č)
( Č cr )
FY18E FY19E
FY18E
FY19E
FY18E
FY19E
FY18E
FY19E
FY18E
FY19E
FY18E
FY19E
FY18E
FY19E
IT
Tech Mahindra
Accumulate
493
526
48,127
30,545
32,988
15.0
15.0
35.2
37.6
14.0
13.1
2.4
2.2
16.8
16.2
1.4
1.2
Wipro
Neutral
301
-
146,536
54,164
56,544
22.3
22.3
18.8
19.5
16.0
15.4
2.6
2.2
15.0
13.6
1.9
1.7
Media
D B Corp
Neutral
340
-
6,261
2,404
2,625
30.5
31.5
23.7
26.9
14.4
12.7
3.4
2.9
23.5
22.8
2.4
2.2
HT Media
Neutral
98
-
2,272
2,589
2,830
15.1
15.4
8.3
10.9
11.8
9.0
1.0
0.9
8.4
10.4
0.4
0.3
Jagran Prakashan
Buy
171
225
5,319
2,541
2,835
28.5
28.7
12.7
14.1
13.5
12.1
2.8
2.4
21.3
21.4
1.9
1.7
Sun TV Network
Neutral
996
-
39,233
3,238
3,789
51.9
55.1
30.9
38.0
32.2
26.2
9.2
8.1
30.0
31.0
11.6
9.8
Hindustan Media
Neutral
246
-
1,805
1,002
1,074
23.3
23.5
29.2
33.8
8.4
7.3
1.3
1.1
15.6
15.4
0.8
0.5
Ventures
TV Today Network
Accumulate
465
500
2,776
667
727
27.7
27.7
18.6
20.1
25.0
23.2
3.9
4.0
15.6
17.3
3.7
3.4
Music Broadcast Limited Accumulate
380
434
2,166
271
317
91.0
109.0
6.0
10.0
63.3
38.0
4.0
3.6
6.5
9.3
7.6
6.2
Metals & Mining
Coal India
Neutral
266
-
165,117
82,301
91,235
17.0
18.0
17.1
20.5
15.6
13.0
2.9
2.7
45.0
55.0
1.7
1.5
Hind. Zinc
Neutral
307
-
129,823
22,108
24,555
57.0
58.0
22.1
26.3
13.9
11.7
4.5
3.7
32.0
35.0
4.9
4.1
Hindalco
Neutral
268
-
60,084
102,350
105,355
13.5
14.5
21.5
24.5
12.5
10.9
1.7
1.5
15.0
15.2
1.2
1.1
JSW Steel
Neutral
264
-
63,887
64,500
68,245
21.1
21.5
20.1
21.2
13.2
12.5
2.4
2.1
-
-
1.7
1.6
NMDC
Neutral
135
-
42,697
10,209
11,450
47.0
48.0
11.1
12.1
12.2
11.2
1.7
1.6
-
-
3.7
3.3
SAIL
Neutral
85
-
35,292
54,100
63,555
3.0
10.0
(10.0)
1.5
57.0
1.1
1.1
-
-
1.6
1.4
Vedanta
Neutral
317
-
117,668
81,206
87,345
28.0
29.0
26.5
33.5
12.0
9.5
2.7
2.3
-
-
2.2
1.9
Tata Steel
Neutral
711
-
69,015
121,445
126,500
16.2
17.2
65.4
81.3
10.9
8.8
1.7
1.5
-
-
1.1
1.0
Oil & Gas
GAIL
Neutral
503
-
85,056
53,115
52,344
14.2
15.3
30.0
31.1
16.8
16.2
2.1
1.9
-
-
1.3
1.3
ONGC
Neutral
193
-
248,195
83,111
84,934
44.2
44.9
16.4
16.9
11.8
11.4
1.4
1.3
-
-
2.9
2.8
Indian Oil Corp
Neutral
410
-
199,214
396,116
432,560
8.5
8.8
40.1
42.2
10.2
9.7
1.8
1.6
-
-
0.6
0.6
Reliance Industries
Neutral
919
-
597,374
257,711
267,438
17.0
18.2
89.1
89.5
10.3
10.3
1.0
0.9
-
-
2.0
1.9
Pharmaceuticals
Alembic Pharma
Accumulate
529
600
9,979
3,346
3,915
19.6
19.2
21.0
23.9
25.2
22.2
4.5
3.8
19.1
18.4
3.0
2.6
Alkem Laboratories Ltd
Accumulate
2,155
2,341
25,766
6,320
7,341
17.5
19.8
72.7
96.6
29.6
22.3
5.2
4.4
16.7
18.7
4.0
3.4
Aurobindo Pharma
Buy
682
823
39,960
17,086
19,478
22.1
22.0
44.7
51.4
15.3
13.3
3.4
2.7
24.7
22.7
2.4
2.1
Aventis*
Neutral
4,718
-
10,866
2,411
2,698
18.8
18.8
151.6
163.9
31.1
28.8
4.8
3.9
25.4
27.5
4.1
3.4
Cadila Healthcare
Neutral
424
-
43,386
11,365
12,926
20.0
20.0
18.4
20.5
23.0
20.7
5.1
4.2
24.3
22.2
3.9
3.4
Cipla
Sell
600
462
48,256
16,163
18,711
16.6
16.9
20.7
24.3
29.0
24.7
3.4
3.1
12.6
13.1
3.1
2.7
Dr Reddy's
Reduce
2,333
2,040
38,687
13,734
15,548
17.7
20.2
69.9
102.0
33.4
22.9
3.0
2.7
9.2
12.4
3.0
2.7
GSK Pharma*
Sell
2,437
2,000
20,644
2,968
3,324
13.8
15.9
37.8
46.3
64.5
52.6
11.3
12.4
16.7
22.4
6.8
6.2
Stock Watch
December 26, 2017
Company Name
Reco
CMP
Target
Mkt Cap
Sales ( Čcr )
OPM(%)
EPS (Č)
PER(x)
P/BV(x)
RoE(%)
EV/Sales(x)
(Č)
Price ( Č)
( Č cr )
FY18E FY19E
FY18E
FY19E
FY18E
FY19E
FY18E
FY19E
FY18E
FY19E
FY18E
FY19E
FY18E
FY19E
Pharmaceuticals
Indoco Remedies
Sell
284
136
2,620
1,114
1,297
9.9
13.9
5.6
11.4
50.8
24.9
3.8
3.4
7.7
14.5
2.6
2.2
Ipca labs
Neutral
600
-
7,572
3,256
3,647
14.1
17.1
16.2
25.4
37.0
23.6
2.9
2.6
8.0
11.5
2.4
2.1
Lupin
Buy
870
1,091
39,341
16,240
18,562
21.3
21.7
42.5
49.6
20.5
17.6
2.6
2.3
13.3
13.7
2.5
2.1
Natco Pharma
Accumulate
985
1,057
18,164
1,886
2,016
32.3
29.5
23.2
22.0
42.5
44.7
8.9
7.9
20.9
17.6
9.5
8.9
Sun Pharma
Buy
531
615
127,280
28,312
31,826
20.7
22.4
18.5
22.3
28.7
23.8
3.3
2.9
11.5
14.0
4.1
3.6
Syngene International
Accumulate
549
587
10,982
1,394
1,818
33.0
36.5
15.8
21.0
34.7
26.2
6.5
5.3
18.6
20.3
7.8
6.0
Power
Tata Power
Neutral
93
-
25,168
32,547
33,806
20.5
20.5
4.7
5.4
19.8
17.4
1.9
1.6
10.5
10.5
1.8
1.7
NTPC
Neutral
180
-
148,253
86,070
101,246
28.3
30.7
12.9
16.2
13.9
11.1
1.4
1.3
10.6
12.4
3.1
2.8
Power Grid
Accumulate
203
223
106,306
29,183
32,946
89.7
90.0
18.0
20.8
11.3
9.8
1.9
1.7
17.7
18.2
7.6
7.0
Real Estate
Prestige Estate
Neutral
301
-
11,269
4,607
5,146
21.0
22.2
7.9
9.8
38.0
30.7
2.3
2.2
10.3
12.0
3.6
3.3
MLIFE
Accumulate
469
522
2,406
487
590
12.3
17.8
21.0
31.2
22.3
15.0
1.2
1.1
5.2
7.4
3.7
3.0
Telecom
Bharti Airtel
Neutral
529
-
211,502
97,903
105,233
36.0
36.3
9.3
11.1
56.9
47.9
2.8
2.6
5.0
5.6
3.1
2.8
Idea Cellular
Neutral
101
-
36,308
35,012
37,689
27.1
27.7
(4.4)
(2.7)
1.6
1.6
(6.8)
(4.6)
2.3
2.1
Others
Abbott India
Neutral
5,541
-
11,775
3,244
3,723
14.9
16.1
167.5
209.4
33.1
26.5
7.3
6.1
23.7
24.8
3.3
2.8
Asian Granito
Accumulate
540
570
1,624
1,169
1,286
12.5
12.5
16.0
19.7
33.8
27.4
3.6
3.2
10.7
11.6
1.6
1.4
Bajaj Electricals
Neutral
477
-
4,850
4,646
5,301
6.7
7.6
16.1
22.3
29.6
21.4
4.8
4.1
16.4
19.2
1.0
0.9
Banco Products (India)
Neutral
262
-
1,873
1,530
1,695
13.2
12.7
19.0
20.0
13.8
13.1
2.2
2.0
0.2
0.2
1.1
127.0
Coffee Day Enterprises
Neutral
277
-
5,699
3,494
3,913
17.4
18.0
4.8
5.7
-
48.6
2.5
2.3
-
0.1
2.1
1.8
Ltd
Elecon Engineering
Neutral
109
-
1,227
171
201
15.0
16.2
36.0
43.0
3.0
2.5
0.3
0.2
0.1
0.1
6.6
5.6
Garware Wall Ropes
Neutral
965
-
2,112
928
1,003
15.2
15.2
39.4
43.2
24.5
22.4
4.0
3.5
16.5
15.4
2.1
1.9
Goodyear India*
Neutral
1,030
-
2,377
1,717
1,866
11.8
12.3
47.9
49.8
21.5
20.7
3.3
2.9
15.6
15.7
1.1
155.1
Hitachi
Neutral
2,603
-
7,078
2,355
2,715
10.3
10.8
49.0
60.9
53.1
42.7
12.4
9.8
0.2
0.2
3.0
2.6
HSIL
Neutral
517
-
3,738
2,240
2,670
14.6
15.0
17.0
22.0
30.4
23.5
2.5
2.4
0.1
0.1
1.9
1.5
Interglobe Aviation
Neutral
1,180
-
45,341
22,570
27,955
14.2
15.0
63.6
81.8
18.6
14.4
9.8
8.2
0.5
0.6
1.7
1.3
Jyothy Laboratories
Neutral
385
-
6,999
1,781
2,044
14.1
15.0
9.4
10.5
41.2
36.7
8.8
8.2
0.2
0.2
4.2
3.5
Linc Pen & Plastics
Neutral
342
-
506
420
462
9.3
9.3
15.3
17.1
22.4
20.0
3.8
3.9
16.9
19.5
1.3
1.1
M M Forgings
Neutral
1,150
-
1,388
542
642
20.1
21.0
41.6
56.8
27.6
20.3
3.8
3.2
0.1
0.2
3.0
2.6
Mirza International
Neutral
161
-
1,934
1,148
1,285
18.0
18.0
8.0
9.4
20.0
17.2
3.3
2.8
16.3
16.1
1.8
1.6
Navkar Corporation
Buy
190
265
2,853
561
617
41.5
41.5
11.5
12.7
16.5
14.9
1.7
1.6
10.5
10.4
5.8
5.0
Stock Watch
December 26, 2017
Company Name
Reco
CMP
Target Mkt Cap
Sales ( Čcr )
OPM(%)
EPS (Č)
PER(x)
P/BV(x)
RoE(%)
EV/Sales(x)
(Č)
Price ( Č)
( Č cr )
FY18E FY19E FY18E FY19E FY18E FY19E
FY18E FY19E
FY18E FY19E
FY18E FY19E
FY18E FY19E
Others
Nilkamal
Neutral
1,838
-
2,743
2,317
2,525
11.4
11.1
96.0
105.0
19.1
17.5
3.3
2.8
0.2
0.2
1.2
1.0
Parag Milk Foods
Neutral
294
-
2,474
1,987
2,379
7.6
9.0
12.4
18.3
23.7
16.1
3.3
2.9
8.2
13.2
1.4
1.2
Radico Khaitan
Neutral
280
-
3,727
1,811
1,992
13.2
13.2
8.1
8.8
34.6
31.8
3.5
3.8
10.1
12.0
2.4
2.2
Relaxo Footwears
Neutral
686
-
8,262
1,981
2,310
13.7
14.5
12.0
15.5
57.2
44.3
11.1
9.0
0.2
0.2
4.2
3.6
Siyaram Silk Mills
Accumulate
747
800
3,499
1,769
1,981
12.7
12.7
22.6
26.2
33.0
28.5
5.1
4.4
15.5
15.5
2.2
1.9
Styrolution ABS India* Neutral
1,060
-
1,864
1,800
1,980
8.0
8.1
42.0
46.2
25.2
22.9
2.8
2.5
0.1
0.1
1.2
1.1
Surya Roshni
Neutral
386
-
1,691
4,870
5,320
7.7
7.8
22.8
28.1
17.0
13.7
2.2
2.0
0.1
0.1
0.6
0.5
TVS Srichakra
Neutral
3,553
-
2,721
2,729
2,893
12.7
12.5
248.5
265.0
14.3
13.4
4.1
3.3
0.3
0.3
1.0
0.9
Visaka Industries
Neutral
624
-
991
1,104
1,214
12.1
12.6
31.0
37.9
20.1
16.5
2.5
2.2
0.1
0.1
1.1
1.0
VIP Industries
Accumulate
354
400
5,000
1,450
1,693
10.4
10.5
6.5
7.8
54.1
45.3
11.4
10.0
21.1
22.1
3.4
2.9
Navin Fluorine
Neutral
814
-
4,015
945
1,154
17.5
17.9
28.7
34.8
28.4
23.4
4.7
4.0
-
-
3.8
3.0
Century Plyboards India Buy
337
400
7,476
2,007
2,510
22.4
22.6
8.4
11.1
40.1
30.3
8.5
6.9
21.3
22.9
4.1
3.3
LT Foods
Accumulate
86
96
2,282
3,287
3,747
11.1
11.5
4.4
5.2
19.4
16.4
2.9
2.4
17.5
17.6
1.2
1.0
Ruchira Papers
Buy
199
244
446
470
532
15.6
15.6
16.5
19.0
12.1
10.5
2.4
2.0
20.0
19.2
1.1
1.0
Source: Company, Angel Research; Note: *December year end; #September year end; &October year end; Price as on December 22, 2017
Market Outlook
December 26, 2017
Research Team Tel: 022 - 39357800
DISCLAIMER
Angel Broking Private Limited (hereinafter referred to as “Angel”) is a registered Member of National Stock Exchange of India
Limited,Bombay Stock Exchange Limited and Metropolitan Stock Exchange Limited. It is also registered as a Depository Participant with
CDSL and Portfolio Manager with SEBI. It also has registration with AMFI as a Mutual Fund Distributor. Angel Broking Private Limited is a
registered entity with SEBI for Research Analyst in terms of SEBI (Research Analyst) Regulations, 2014 vide registration number
INH000000164. Angel or its associates has not been debarred/ suspended by SEBI or any other regulatory authority for accessing
/dealing in securities Market. Angel or its associates/analyst has not received any compensation / managed or
co-managed public offering of securities of the company covered by Analyst during the past twelve months.
This document is solely for the personal information of the recipient, and must not be singularly used as the basis of any investment
decision. Nothing in this document should be construed as investment or financial advice. Each recipient of this document should make
such investigations as they deem necessary to arrive at an independent evaluation of an investment in the securities of the companies
referred to in this document (including the merits and risks involved), and should consult their own advisors to determine the merits and
risks of such an investment.
Reports based on technical and derivative analysis center on studying charts of a stock's price movement, outstanding positions and
trading volume, as opposed to focusing on a company's fundamentals and, as such, may not match with a report on a company's
fundamentals. Investors are advised to refer the Fundamental and Technical Research Reports available on our website to evaluate the
contrary view, if any.
The information in this document has been printed on the basis of publicly available information, internal data and other reliable
sources believed to be true, but we do not represent that it is accurate or complete and it should not be relied on as such, as this
document is for general guidance only. Angel Broking Pvt. Limited or any of its affiliates/ group companies shall not be in any way
responsible for any loss or damage that may arise to any person from any inadvertent error in the information contained in this report.
Angel Broking Pvt. Limited has not independently verified all the information contained within this document. Accordingly, we cannot
testify, nor make any representation or warranty, express or implied, to the accuracy, contents or data contained within this document.
While Angel Broking Pvt. Limited endeavors to update on a reasonable basis the information discussed in this material, there may be
regulatory, compliance, or other reasons that prevent us from doing so.
This document is being supplied to you solely for your information, and its contents, information or data may not be reproduced,
redistributed or passed on, directly or indirectly.
Neither Angel Broking Pvt. Limited, nor its directors, employees or affiliates shall be liable for any loss or damage that may arise from
or in connection with the use of this information.